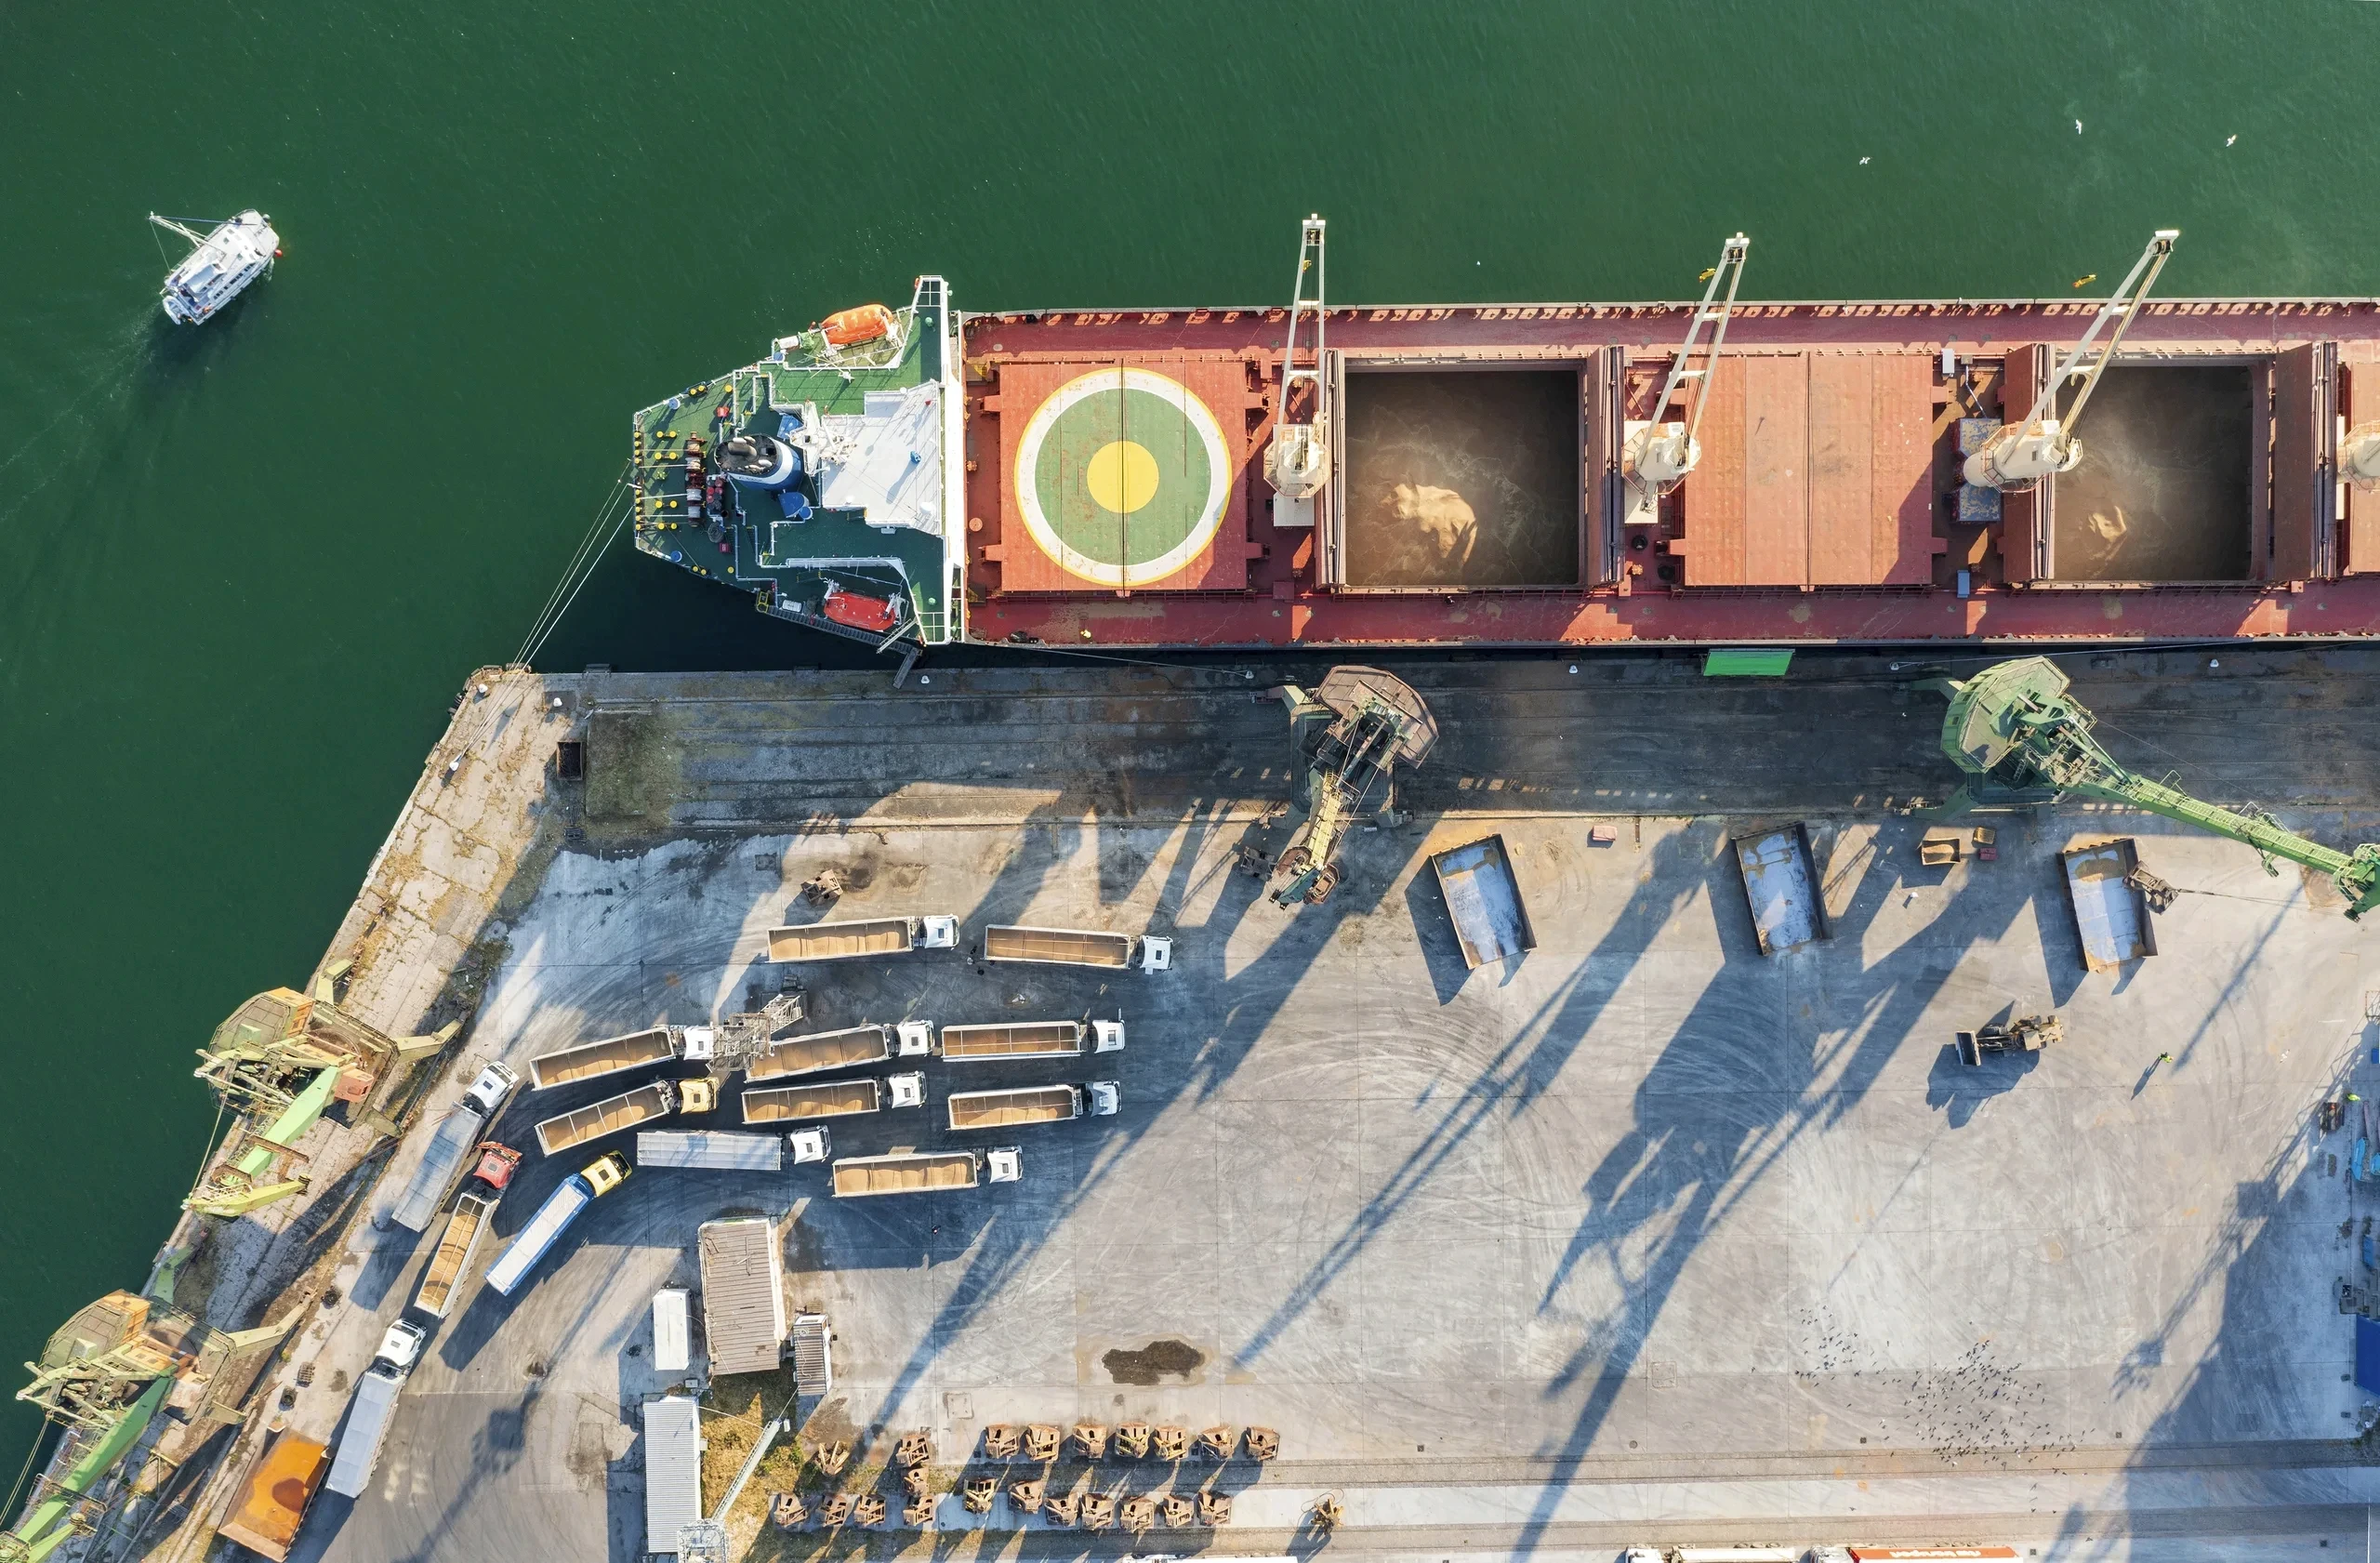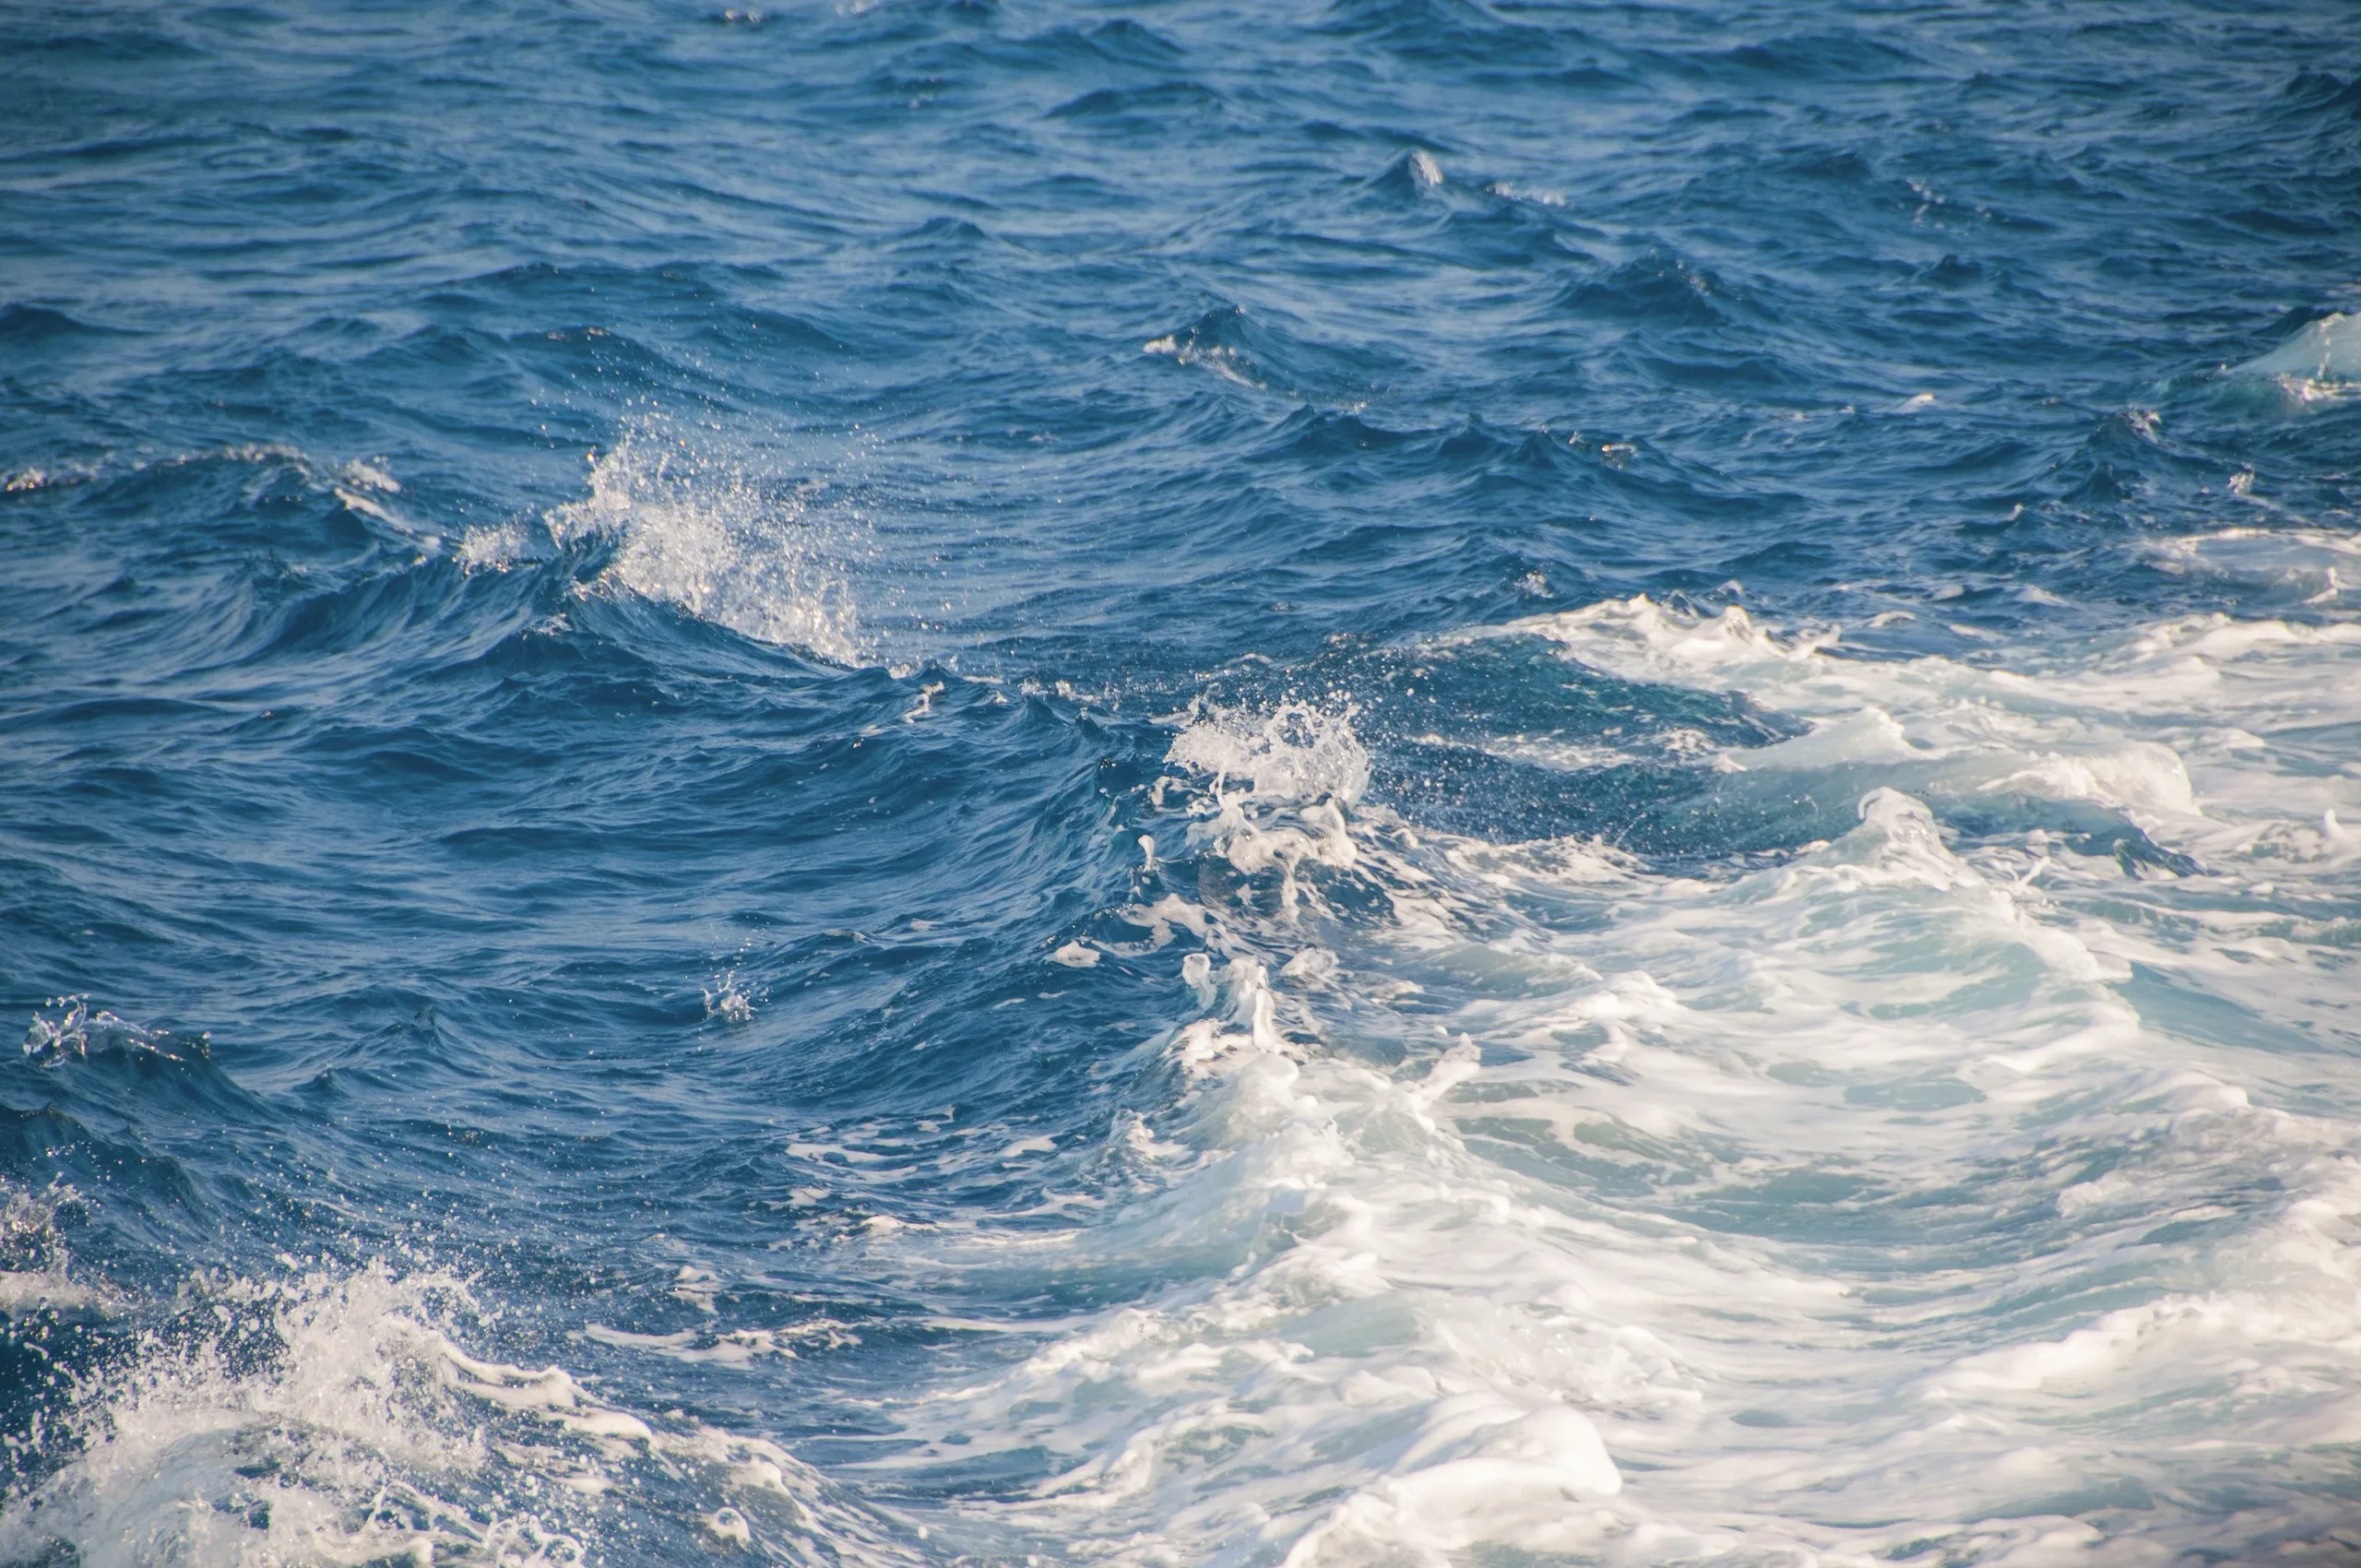
Swell Delays Port Risk — hero image

Utilising an advanced platform like PortLog is representative of our commitment to delivering a more optimised and efficient freight service in our customers' supply chain

Portrait of Pacific Basin

Pacific Basin PortLog

Swell is easy to underestimate. It arrives as long, low waves generated by weather far out at sea, often under a clear local sky, and it can close a berth or hold a vessel off a port when conditions look calm from the bridge.

That gap between how it looks and what it does is where it costs money: suspended cargo operations, parted mooring lines, and time lost to laytime and demurrage.

The Marcura Analytics team studied more than 1,800 recorded swell events from statements of fact, counting only the calls where swell was logged specifically rather than as general "bad weather." The true scale is almost certainly higher.
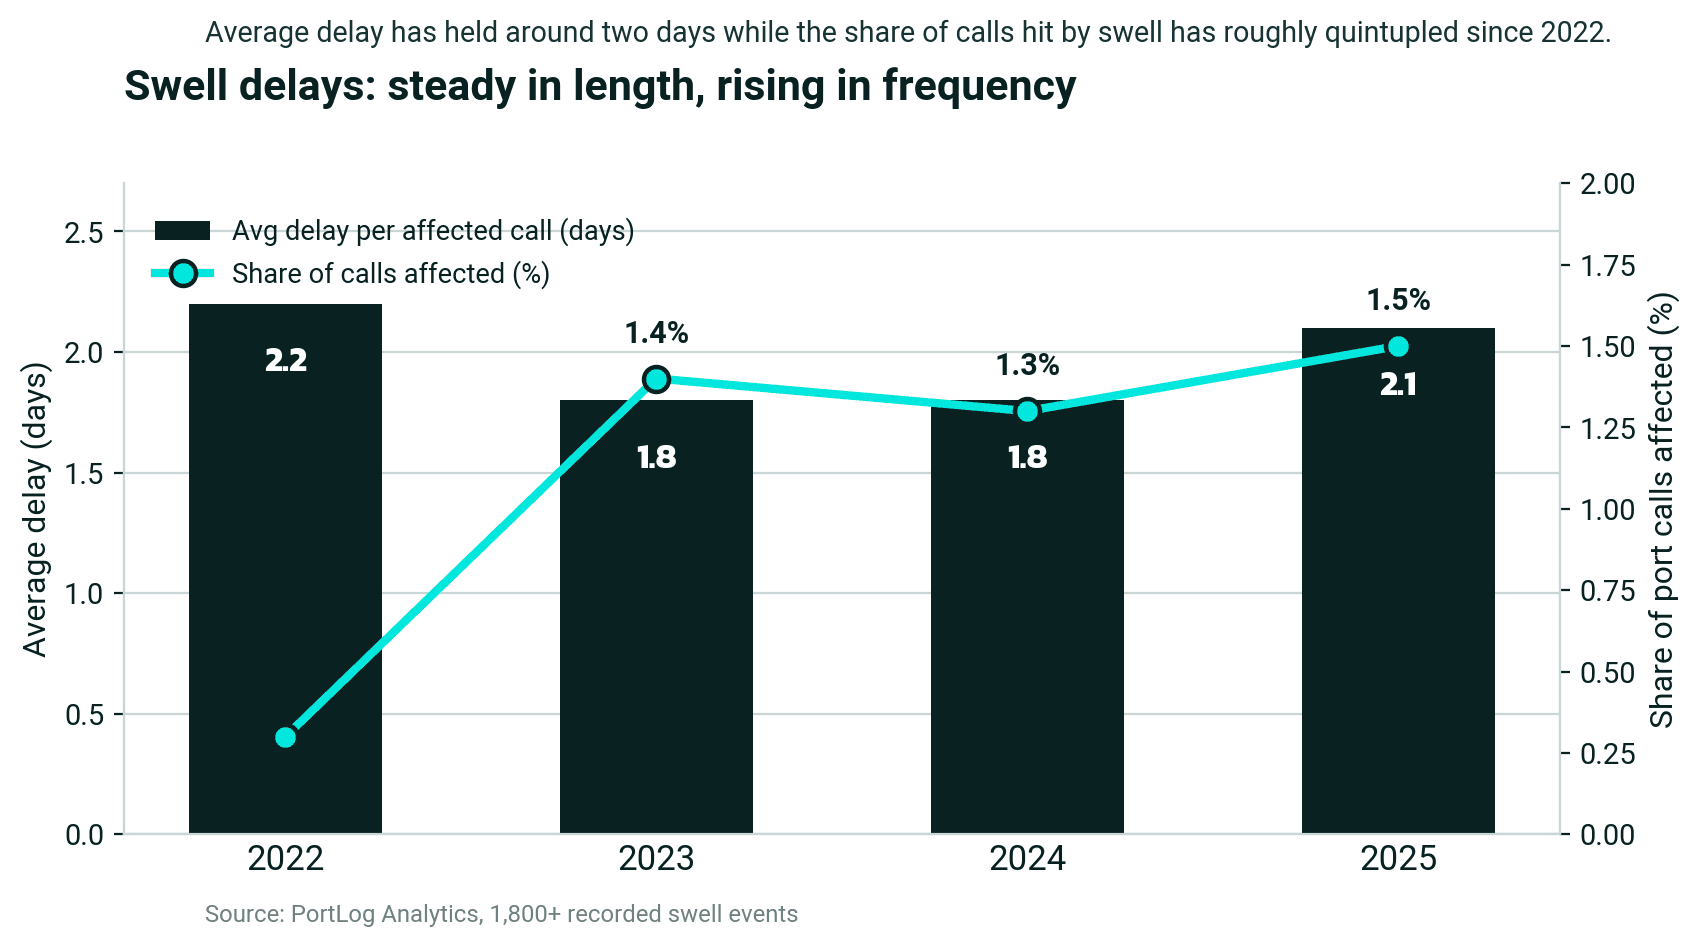
The length of a swell delay has held steady at around two days. What has changed is how often it strikes, close to a fivefold rise since 2022.

Most of the delay happens before you berth

The instinct is to treat swell as a cargo-operations problem. The data says otherwise.
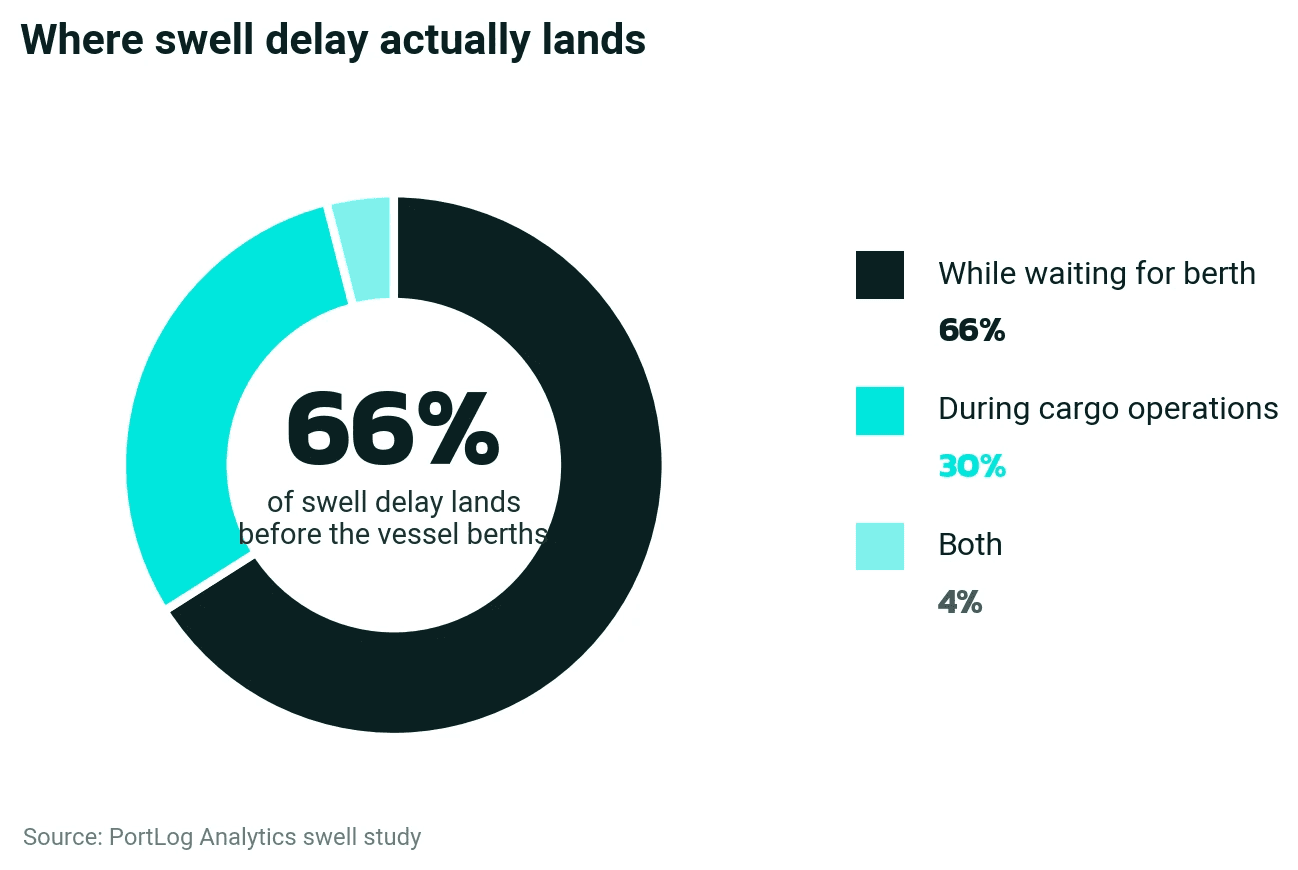
Two thirds of swell delay lands while the vessel is still waiting for a berth. A clause or a buffer built only around alongside operations misses where most of the lost time actually sits.

Where it hits hardest

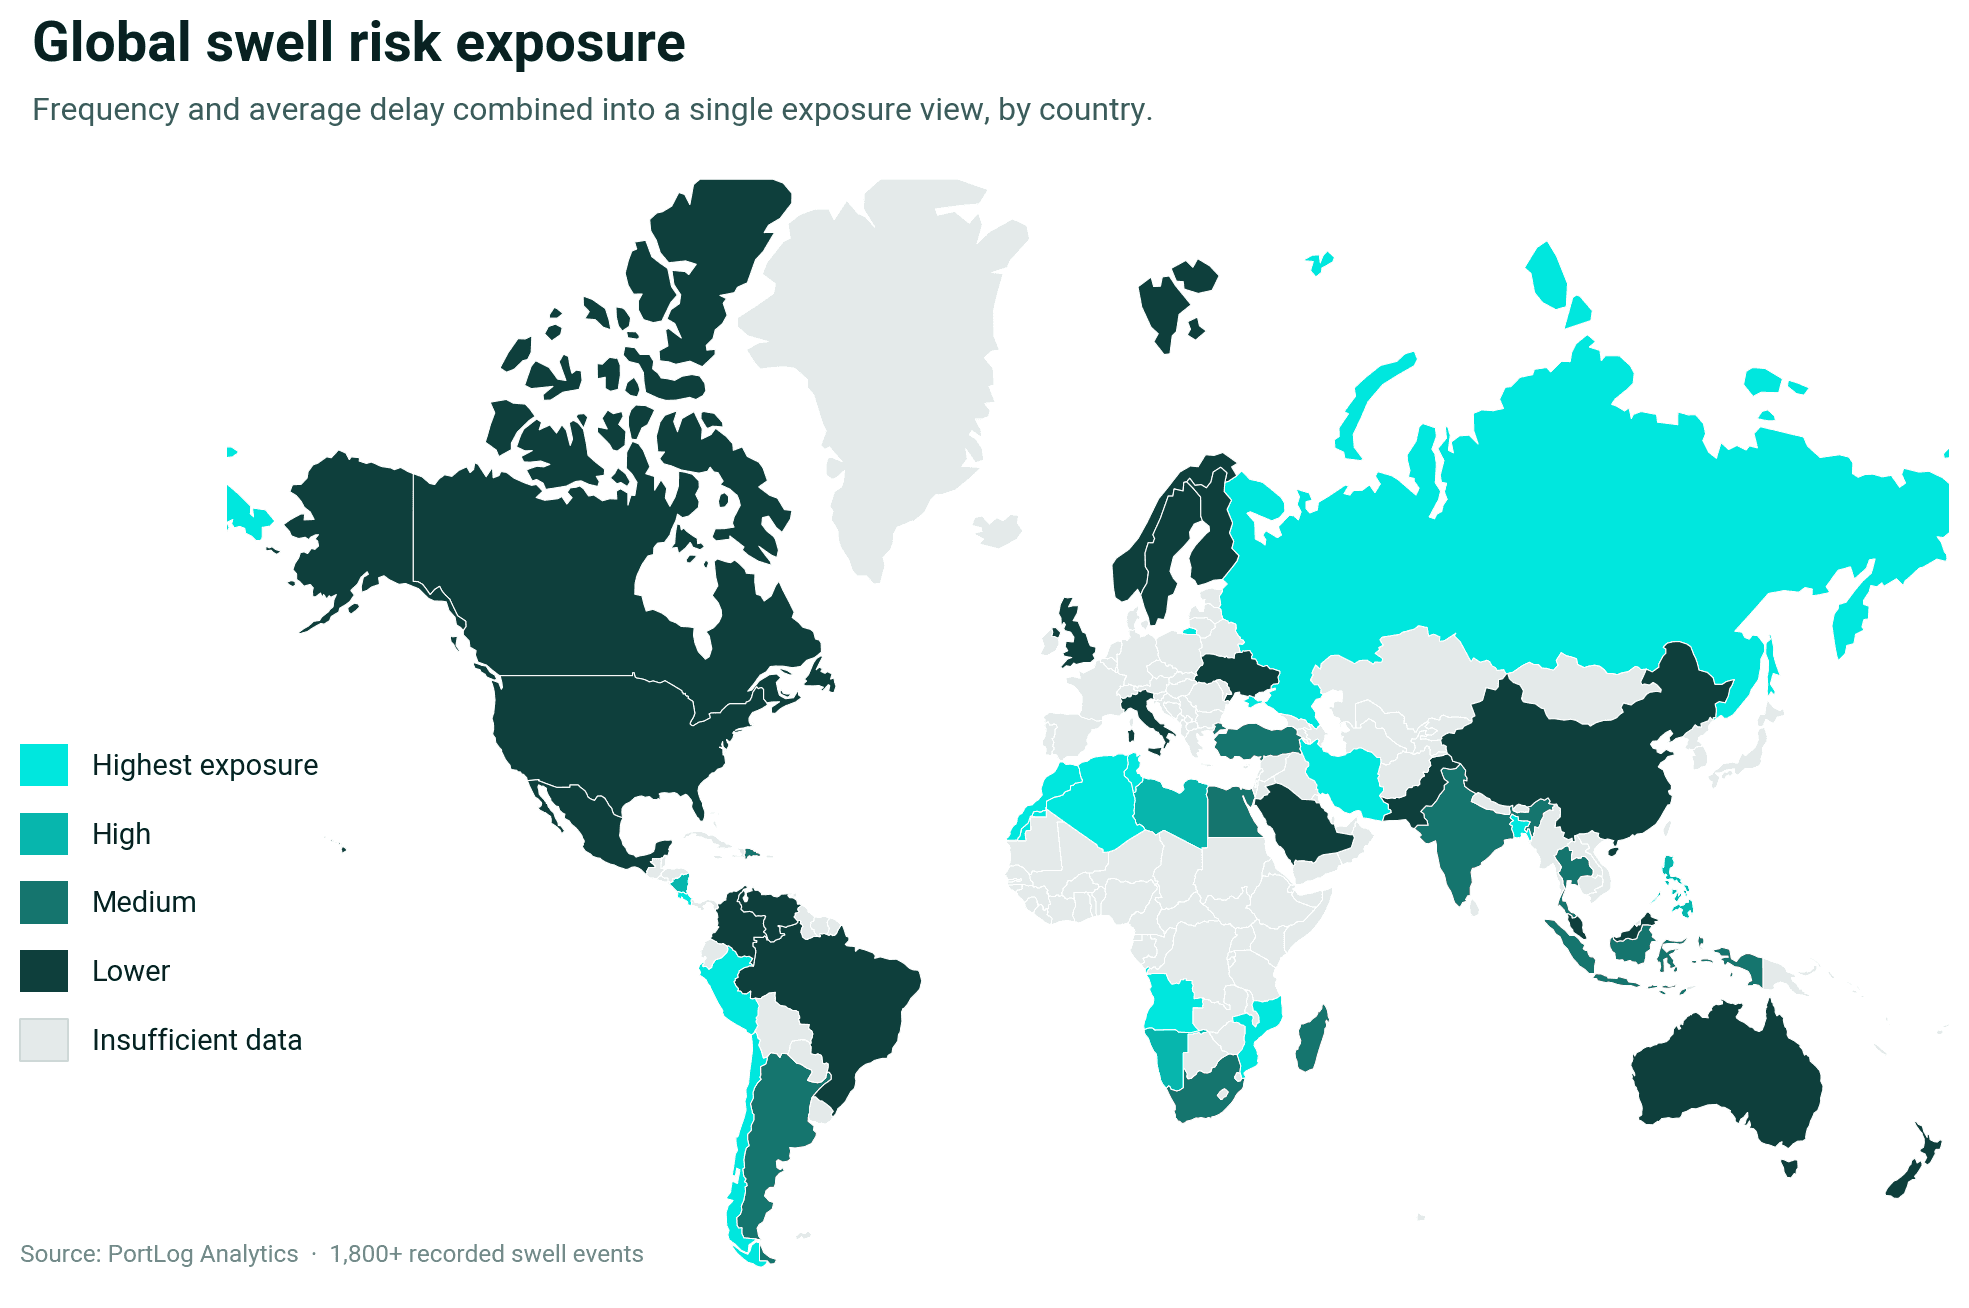
Swell exposure is regional and seasonal, and it concentrates on a handful of coasts. South America's Pacific seaboard and the ports of West and North Africa carry the heaviest risk.
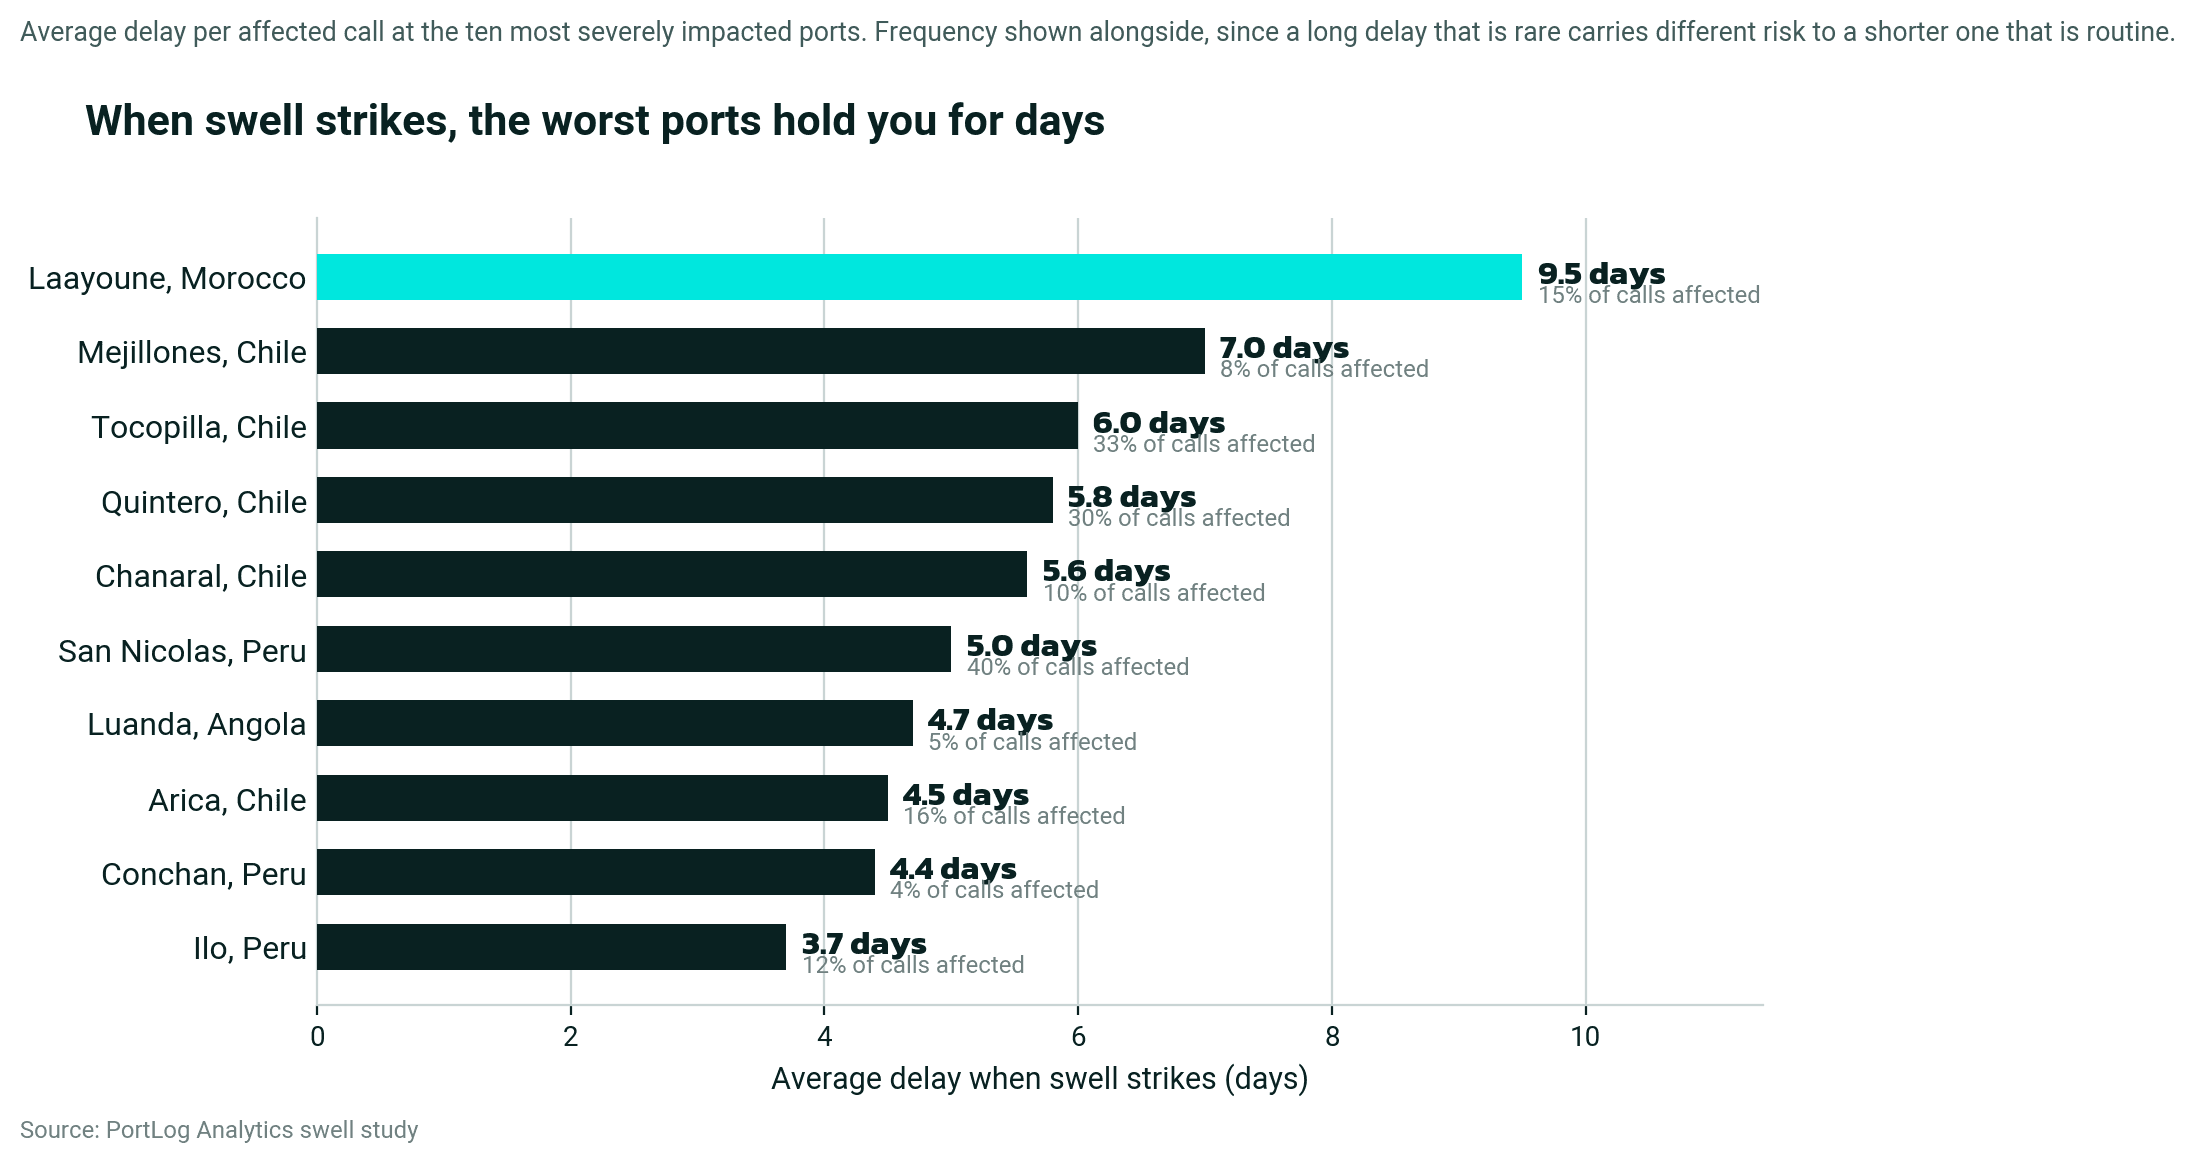
When swell strikes at the worst of these ports, it holds vessels for days rather than hours. At Laayoune the average is more than nine.
The cost rarely appears as a line marked "swell." It surfaces as demurrage, laytime disputes, and voyage results that came in worse than the estimate.

Two days of waiting against a demurrage rate is a material number on a panamax or capesize fixture, and a nine-day wait can turn an estimate upside down.

Open magazines with a ship image and a book titled "Navigating New Financial Realities" on a surface.

Managing hold rejection risk

Learn how to transforms hold rejection at port from an unexpected margin-killer into a manageable, budgetable risk

How charterers can manage swell risk

Swell is a mappable risk, which means it can be planned for rather than simply absorbed.

Price it or share it. Where the freight rate cannot carry the swell risk on an exposed trade, address it in the charter party: how laytime is treated during a closure, who covers mooring rope damage, liability for damage to vessel or berth, and pilot or tug standby. These are observations of industry practice, not legal advice, and the right wording depends on the trade.

Build realistic buffers. Where a clause is not achievable, build the port's swell exposure for the season into the voyage estimate, rather than discovering it after the fact.

Record swell as swell. Instruct agents to log it specifically in the SOF. Precise recording is what lets the relevant clauses be invoked, and it sharpens the next estimate.

How PortLog helps

Swell is predictable enough to plan around once you can see the pattern. PortLog draws on the recorded swell history across global port calls to show:

  • Port-level frequency and average delay, so exposure is a known figure before fixing

  • Regional risk and seasonality, showing which ports and months carry the most risk

  • A consolidated global view, to assess a trade or rotation against historical swell exposure at a glance

The intelligence supports the decision. The charterer or operator still makes the call on how to fix, how to clause, and where to buffer, now with the swell record in front of them.

If swell keeps showing up in your demurrage numbers, it's worth a look at where it's coming from on your trades. Learn more on how our team can help here


Which ports and regions are most affected by swell?

South America's Pacific coast and the ports of West and North Africa carry the highest swell risk. The most severely affected ports include Laayoune in Morocco, Mejillones, Tocopilla and Quintero in Chile, and San Nicolas in Peru, where swell is recorded on up to 40% of calls.

How long do swell delays usually last?

Swell delays average around two days per affected port call, a figure that has stayed steady since 2022. At the worst-affected ports it runs far longer: Laayoune in Morocco averages more than nine days, and several Chilean ports average between five and seven.

How common are swell delays, and are they increasing?

Swell delays are becoming more frequent. The share of port calls affected rose from 0.3% in 2022 to 1.5% in 2025, close to a fivefold increase, while the length of each delay held steady. The figures draw on more than 1,800 recorded events, so the true scale is likely higher.

When during a port call do swell delays happen?

Most swell delay happens before the vessel berths. Two thirds (66%) of recorded swell delay occurs while the vessel is still waiting for a berth, 30% during cargo operations, and 4% across both. The disruption concentrates at the approach, not alongside.

Which ports and regions are most affected by swell?

South America's Pacific coast and the ports of West and North Africa carry the highest swell risk. The most severely affected ports include Laayoune in Morocco, Mejillones, Tocopilla and Quintero in Chile, and San Nicolas in Peru, where swell is recorded on up to 40% of calls.

How long do swell delays usually last?

Swell delays average around two days per affected port call, a figure that has stayed steady since 2022. At the worst-affected ports it runs far longer: Laayoune in Morocco averages more than nine days, and several Chilean ports average between five and seven.

How common are swell delays, and are they increasing?

Swell delays are becoming more frequent. The share of port calls affected rose from 0.3% in 2022 to 1.5% in 2025, close to a fivefold increase, while the length of each delay held steady. The figures draw on more than 1,800 recorded events, so the true scale is likely higher.

When during a port call do swell delays happen?

Most swell delay happens before the vessel berths. Two thirds (66%) of recorded swell delay occurs while the vessel is still waiting for a berth, 30% during cargo operations, and 4% across both. The disruption concentrates at the approach, not alongside.

Which ports and regions are most affected by swell?

South America's Pacific coast and the ports of West and North Africa carry the highest swell risk. The most severely affected ports include Laayoune in Morocco, Mejillones, Tocopilla and Quintero in Chile, and San Nicolas in Peru, where swell is recorded on up to 40% of calls.

How long do swell delays usually last?

Swell delays average around two days per affected port call, a figure that has stayed steady since 2022. At the worst-affected ports it runs far longer: Laayoune in Morocco averages more than nine days, and several Chilean ports average between five and seven.

How common are swell delays, and are they increasing?

Swell delays are becoming more frequent. The share of port calls affected rose from 0.3% in 2022 to 1.5% in 2025, close to a fivefold increase, while the length of each delay held steady. The figures draw on more than 1,800 recorded events, so the true scale is likely higher.

When during a port call do swell delays happen?

Most swell delay happens before the vessel berths. Two thirds (66%) of recorded swell delay occurs while the vessel is still waiting for a berth, 30% during cargo operations, and 4% across both. The disruption concentrates at the approach, not alongside.

Open magazines with a ship image and a book titled "Navigating New Financial Realities" on a surface.

Our short product walkthrough explains how charterers and operators use Portlog to forecast and plan voyages

Know the port, Know the Risk

Digital documents displaying data visuals and insights, with the title "Beyond the Model" prominently featured.

New guide

Take control of Procure-to-Pay

Why invoice control breaks down between PO and payment — and how leading ship managers close the gap. Free guide, plus two diagnostic tools.

brown concrete building near body of water during daytime

Products

Solutions

Marcura AI

Resources

Careers

Book a demo

Products

Solutions

Marcura AI

Resources

Careers

Book a demo
Event preview
Live webinar
One System for Every Drydocking, Repair, and Inspection
One cloud platform for drydockings, repairs, refits and inspections — with supplier sourcing and approvals built in.
Live webinar
One System for Every Drydocking, Repair, and Inspection
One cloud platform for drydockings, repairs, refits and inspections — with supplier sourcing and approvals built in.